
This opens up a whole new can of worms.
As the Holiday Season of Thanks, Grace and Opportunities Ahead (Thanksgiving, Christmas, New Year’s) arrives, a colleague of mine begins a Kickstarter campaign which led me to pause. I had to reflect on how relevant these events are to each other. In fact, my colleague offers what M E Porter calls an opportunity to create shared value (CSV). If you understand the concepts of creating value, and sharing values this may be something you will want to review.
M E Porter offers “The concept of shared value can be defined as policies and operating practices that enhance the competitiveness of a company while simultaneously advancing the economic and social conditions in the communities in which it operates. Shared value creation focuses on identifying and expanding the connections between societal and economic progress.” (HBR.org). In short, ‘profits ain’t everything.’
By merging hobbies, communities, locally owned enterprises, and a consumer with a desire to see all succeed, this Kickstarter campaign offers a micro-experiment in the future viability of creating value and sharing values as an important economic model. I hope you will take the time to read more about this campaign (https://www.kickstarter.com/projects/395770625/gethooked-performance-apparel-and-gear).
This week is the first week this year I haven’t traveled since January. A welcomed break. I usually take these times to de-clutter files, physical and electronic. Working through the physical records, I found a small notebook titled “Management Lessons.” I was writing this over 11 years ago. One of the lessons in there was ‘The 6X Rule.’ What follows are my notes on the topic, some post it notes I just found my wife placed there over 11 years ago. What I learned from this.
“There is a rule that exists that has seldom been understood. It has caused many to feel frustrated and confused. It has led to many misunderstandings between management and staff/employees. It is called the 6X rule. This rule defines the minimum number of times someone in management must tell a staff member before they actually hear a message. Several times in my management career I became frustrated because of a lack of involvement of the staff and employees. Putting out a memo, sending an email and expecting everyone to be involved only led to disappointment. Confronting staff or employees on the matter, their response was ‘I didn’t see it.’My reaction, frequency and variety matters. So I kept increasing and varying the manner of communications until I saw the level of involvement I desired. That number was 6 times, and in a variety of ways (emails, memos, in person, on the phone, in meetings, at lunch).”
I turn now in those notes and make this personal, my mistake. “Why 6X? I do not know. I look in my own life to see if that pattern exists in me. Nope. My boss or wife or children have not had to consistently tell me 6 times to do anything.”
What brought me to this chapter in the book were a series of post it notes with my wife’s handwriting. On one post it note, “This rule applies to Managers too. I’ve asked you 6 times (I counted) to tighten the oriental ornament in the backyard.” Ouch. Me? On the other side of the page where my notes exalted my rise above the masses was another 4 post it notes “Perhaps this will clear up the misunderstanding;
1. It may not seem important at the time
2. It’s really not that important
3. I have other things to worry about, it’s not that important
4. That’s just plain dumb, and therefore not important
5. What a crazy request when I am so important
6. I am full of myself. Your request is belittling me now. Its not important
She goes on further in the post it notes, “Well the $1,200 oriental yard ornament just broke. It broke because it wasn’t tightened. It’s not important to you but it was important to someone else. Therefore it did in fact matter. So see, that’s why it takes 6X’s to get someone to listen.”
Well now. I see a pattern. She failed to tell me it cost $1,200! But seriously, she has a point.
Are we communicating the things that are in fact important, why they’re important and how others’ involvement is needed? If an email went out to all staff and employees “Bonus checks will be handed out at 12:04 pm on Wednesday in the southeast corner of the floor below the HR department”, trust me all will be there. Anything less than that requires an ability to make the call to action important and relevant in staff and employees’ lives. So maybe it was the message and messenger after all.

http://www.statista.com/chart/2142/airline-complaints-per-100000-emplanements/
When it comes to airline complaints in the United States, low cost carrier Spirit is way ahead of the competition. In fact, passengers are three times as likely to have an issue with Spirit as the country’s next most complained-about carrier, Frontier Airlines.
In 2013, Spirit had 9,440 complaints per 100,000 enplanements, an incredibly high figure. These relate to everything from delayed flights to issues with baggage. Frontier Airlines came second in 2013 with 3,087 complaints per 100,000 enplanements while United rounded off the top three with 2,144.
Since 2009, the annual revenues of Spirit has climbed from about $781 million to $1.6 billion. The facts could lead one to conclude that customer service does not matter after all. A better conclusion is Spirit has not “failed” to meet customer expectations of customer service. The expectations are already low, and the value received (trip) for the cost and the low customer service meets a market demand.
Are you as a company, trying to deliver excellent customer service? Is excellent customer service, or WOW! really needed? Is there an opportunity cost to not leveraging your real capability due to slavish devotion to the idea of WOW!?

http://www.statista.com/chart/2072/landline-phones-in-the-united-states/
According to data provided by the Center of Disease Control and Prevention (PDF), landline phones are gradually losing relevance in the United States. The CDC has tracked phone ownership by U.S. households as a by-product of its biannual National Health Survey since 2004. Since then the percentage of households that have a landline phone has dropped from 92.7 percent to 58.1 percent, while the percentage of households with only cellphones has risen from 5 to 39.4 percent.
First it’s pay phones, then phone books, now the home phone will become extinct.
The debate about whether or not young people are losing interest in Facebook has been going on for a while now. Some say it’s a problem that the media invented, others say that teenagers are indeed jumping ship in favor of new, more hip services such as Instagram, Snapchat or Tumblr.
Yesterday, iStrategyLabs came out with a report that appears to prove Facebook’s teenager exodus. According to iStrategy, which pulls its data from Facebook’s social ad tool, the number of users aged 13-24 in the United States has declined by more than 6 million since January 2011. If the data is correct, Facebook’s teenage user base in the U.S. shrank by an alarming 25 percent in the past three years, indicating that Facebook does indeed have trouble reaching young users.
What will be the impact on the social media giant? Having recovered from the botched IPO, will this be Mark’s next biggest revenue challenge?


http://www.statista.com/markets/14/media-advertising/chart/1330/media-use-in-the-us/
Digital media use of American adults will surpass TV use for the first time this year. According to recent eMarketer estimates, Americans aged 18 and older will spend an average of 4 hours and 40 minutes per day on their computers and mobile devices, exceeding TV time by 9 minutes.
The sharp increase in digital media use is primarily caused by the rise of smart mobile devices. The non-voice use of mobile devices jumped from just 24 minutes in 2010 to 2 hours and 21 minutes this year. This increase happened at the expense of print media, as the use of newspapers and magazines continued to decline.
Please note that eMarketer’s estimates do include multitasking time, i.e. time spent using a smartphone while watching TV is counted towards the totals of TV and mobile both.
The Washington Post, the seventh largest daily newspaper in the United States and one of the country’s most renowned publications, is being sold to Amazon.com founder and CEO Jeff Bezos, in a $250 million all-cash deal that surprised the media industry on Monday afternoon. Just this weekend, the New York Times Company had announced the sale of The Boston Globe, making Bezos’ acquisition of The Washington Post the second large-scale newspaper deal in the past few days.

http://www.statista.com/topics/994/newspapers/chart/1333/circulation-at-the-washington-post/
The deal also marks the end of an era in newspaper publishing, as the selling Graham family, whose ownership of the Post dates back 80 years, is succeeded by Jeff Bezos, an internet entrepreneur best-known for building the world’s largest e-commerce company. The fact that his company, Amazon.com, has recently ventured into digital publishing, has possibly been the only hint that Bezos could be interested in buying a newspaper. Hence not only the sale itself, but also the name of the buyer came as a surprise.
Just as many other newspapers, The Washington Post has been struggling with declines in circulation and ad sales for some time now. Average daily circulation dropped 38 percent in the past 10 years and the Post has been slower than some of its rivals in adapting to new digital realities. According to the Alliance for Audited Media, daily digital circulation of The Washington Post averaged at 42,313 between October 2012 and March 2013. Both The New York Times and The Wall Street Journal reported digital circulation more than 20 times as high. Maybe an internet whiz such as Jeff Bezos is just the right guy to fix that. At the very least it will be interesting to observe what Bezos’ vision for the newspaper’s future is.

http://www.statista.com/topics/1002/mobile-app-usage/chart/1345/top-10-smartphone-apps-in-q2-2013/
Google Maps is the most-used smartphone app in the world. According to data published by GlobalWebIndex, 54 percent of global smartphone owners used Google’s navigation app in the month preceding the survey. Facebook’s smartphone app ranks second with 44% of smartphone owners using it. The fact that YouTube and Google+ are ranked third and fourth shows Google’s dominant role in the mobile marketplace: three of the four most-used smartphone apps in the world are Google apps.
Google’s decision to develop an open source mobile operating system and give it away for free apparently pays off. Android’s market share in the smartphone market recently soared above 70 percent and since Android phones come preloaded with several Google apps, the search company controls a significant share of mobile web usage.


http://www.statista.com/topics/824/groupon/chart/1355/groupon-stock-price/
A little less than half a year ago, on February 28, Groupon founder Andrew Mason was fired as CEO of the company he built. His dismissal came as no surprise at that point, since he had had to report another weak quarter to disappointed investors the day before.
Mason’s exit and the appointment of co-founder Eric Lefkovsky as interims CEO was greeted favourably on Wall Street and Groupon’s troubled stock began climbing right after the news had broken. Last Wednesday, after the stock had closed at $8.72, up 92 percent from its February low, the company announced that Lefkovsky has been named permanent CEO. That news, combined with positive second quarter results gave Groupon’s stock price another boost and it shot up more than 21 percent the next day.
On Friday, Groupon shares closed at $10.61, up 134 percent since Mason’s dismissal in February. The company still has a long way to go in reaching its IPO price of $20, but its new leadership appears to be on track to successfully transform Groupon from a daily deals platform to a more versatile online marketplace.

According to Statcounter, 25.5 percent of mobile page views by smartphones in June 2013 came from Samsung devices. This means that the South Korean manufacturer is slightly ahead of arch competitor Apple for the very first time. Together, the iPhone and iPod Touch accounted for 25.4 percent of global page views during the same period. Statcounter claims that 15 billion monthly page views to more than three million websites forms the basis for the calculations.

For the first time in years, Samsung posted a higher quarterly profit than Apple last Friday. The company made $6.93 billion in the past three months as it continued to dominate the smartphone market. Samsung shipped 72.4 million smartphones from April through June, outselling its biggest rival Apple more than 2 to 1.
However, like Apple, Samsung is starting to feel the effects of increasing saturation in the high-end smartphone market, in which the lion’s share of profits is generated. In the lower end of the market, where much of the future growth is expected to happen, Samsung faces increasingly stiff competition from Chinese manufacturers. Hence, the company warned investors that its growth might slow down in the current quarter.

Amazon reported a $7 million loss for the second quarter of 2013, as the company continues to sacrifice short-terms profits in favor of long-term growth.
In the past three months, the Seattle-based e-commerce giant invested heavily into warehouses, digital content and its Kindle business and subsequently reported a minor loss despite healthy revenue growth. The company posted net revenue of $15.7 billion, a 22 percent increase over last year’s second quarter.
The results were just below what analysts had expected, but the stock price gave in only slightly following the release.
Amazon’s shareholders remain remarkably trustful of CEO Jeff Bezos’ long-term vision. Despite the lack of profits, the company is currently traded at a valuation of almost $140 billion, putting Amazon’s price-to-earnings ratio at outer worldly levels.
Our chart illustrates how Amazon’s revenue continues to soar, while the company fluctuates between miniscule losses and small profits.
http://www.statista.com/topics/846/amazon/chart/1299/amazons-revenue-and-profit-growth/


On Wednesday, Facebook released its financial results for the second quarter of 2013. The social network increased its sales by 53 percent to 1.8 billion U.S. dollars in comparison to the same quarter last year. Profit amounted to 333 million U.S. dollars. A year earlier, Facebook posted a loss of 157 million U.S. dollars.
Mobile advertising is always a good way to get the ball rolling. Total advertisement increased by 11 percentage points in comparison with the previous quarter, reaching 41 percent. In a parallel development, ther number of mobile users has noticeably risen. The total number of monthly active users grew by 4 percent in comparison to the previous quarter, with the amount using the social network from mobile devices reaching 16 percent. In contrast, the number of desktop users accessing Facebook fell by six percent. As a result, desktop advertising revenue subsequently shrank by five percent.
On the stock market, Facebook’s strong quarterly numbers were well received. The social network’s shares increased by 20 percent after trading hours and are currently worth 32 U.S. dollars. That is not too far from the 38 U.S. dollar valuation of the shares at the company’s IPO.
http://www.statista.com/topics/751/facebook/chart/1078/facebooks-mobile-users/

http://www.statista.com/topics/847/apple/chart/1292/apple-reports-second-successive-profit-decline/
Apple earned 6.9 billion U.S. dollars in profit from April to June, 2013, representing a decline of 21.8 percent on the same period last year. Revenue slightly increased by 0.9 percent to 35.3 billion U.S. dollars. In comparison to the third quarter of 2012, the number of iPhones sold grew 20 percent to 31.2 million, but fell by 17 percent when compared with the previous quarter. On the other hand, the number of iPads sold fell by 14.6 million. Therefore, the sale of Apple tablets was considerably fewer in comparison to the previous year (-14 percent) and the previous quarter (-25 percent). It is important to keep in mind that Apple’s third quarter sales figures are traditionally weaker because the company usually conducts an autumn release of its latest iPhone model. Potential buyers avoid purchasing current models, waiting instead for the new product.

http://www.statista.com/topics/1070/pcs/chart/1281/pc-shipment-growth/
There are many possible reasons for the recent decline of the PC industry. Some blame Windows 8, others blame saturated markets or the weak economy. Considering the fact that the negative trend began in the second quarter of 2010, one other possible reason for the decline of PC sales jumps to mind: the release of the iPad.
Since Apple revived the tablet industry with the release of the first iPad in April 2010, PC shipment growth has gradually died off and ultimately vanished completely. Global PC shipments have now declined for five consecutive quarters, most recently at an alarmingly high negative growth rate of 11 percent.
Obviously there are several reasons for the recent drop in PC sales, but looking at the chart makes it hard to argue against the iPad as one of them. Tablets have given consumers another choice when it comes to fulfilling their computing needs. It turns out, for many a full-blown personal computer is no longer the most convenient and cost-effective option.

According to data from Pew Research recently released, we Americans seem to trust journalists less than many other occupations. This should not come as a surprise to anyone. Somewhere along the way, we as a Nation based partly on the principle of freedom of the press, allowed journalists and media outlets to overtly drive their social agendas throughout the news channels. Whether from the right or the left, what is left out is “just the facts ma’am” news code. Perhaps it is merely a reflection of our Nation’s inability to listen, enquire, discuss and debate issues and then as a body of constituents, make a democratic decision. As the ocean’s tides rise and fall, so may the tradition of democracy founded in a country of city-states in ancient Greece. And the fourth estate which was granted special placement in the Bill of Rights to be a sentry of information, has like a thief in the night stolen something precious while we slept.

According to data collected from census.gov site, gas station operators are enjoying increasing level of profits. It is not disconcerting profits for these operators are climbing. What is troubling is their hypocrisy and obvious price fixing.
The claim gasoline sales is not profitable, is not true. Furthermore, the claim margins are so low for gasoline it a loss leader to attract buyers into their over-stuffed kiosk-style cashiering sites (aka: store), is not true. If that were true, why would they have added the credit card swipe to the gas pump. I can not remember the last time I ventured into a store.
To accept their claim gasoline margins are near zero requires proof margins are expanding for store sales. The largest volume sales for gas station operators is gas, lottery tickets, cigarettes/beer. And they have voluntarily deprived themselves by letting credit card transactions happen at the pump and not drag foot traffic into the store. Really?
Price fixing is evidenced by a simple of comparison of prices on each of the four corners of any intersection in the U.S. Ever see a price war break out there? How about comparing the prices in wealthier neighborhoods to prices in lower socio-economic areas.
Any operator in a capitalist endeavor should be encouraged to maximize profits, the conditional is fairly.

http://www.statista.com/markets/14/media-advertising/chart/1266/mobile-ad-spend-per-subscription/
Global mobile advertising revenue nearly doubled in 2012, increasing from $4.9 billion to $9.1 billion. That’s according to a study conducted by the Interactive Advertising Bureau and market intelligence group IHS. The report identifies the Asia/Pacific region as the largest mobile ad market in the world with revenue of $3.66 billion in 2012. At $3.63 billion, the North American market is just slightly smaller and Europe follows third with mobile ad spend of $1.54 billion.
The fact that mobile ad spending in Asia/Pacific exceeds the North American level appears surprising at first, but there is a simple explanation for it. The only reason for the high level of spending is the sheer size of the Asian market. Looking at ad spend per mobile subscriber delivers an entirely different result. It is in fact North America that is far ahead in mobile monetization. In 2012, average ad spend per mobile subscription in North America was $9.39, whereas it was only $1.32 in Asia/Pacific and $2.91 in Western Europe. Anyway, the numbers suggest that there is a lot of growth potential in mobile advertising.

Nielsen research finds that the most popular second screen for watching TV is your personal computer, even more so than your DVR! Not that this is a surprise given the long tail demands to choice of viewing times. Where possible, the self service option the digital age offers becomes the disrupting influence to the industries.

As the use of smart phones rise, the Android platform is becoming the most popular, growing 15% since May 2011 – making up 28% of all smart phone users – compared to the 10% growth of iPhone users, or 25% of all users.

http://www.statista.com/topics/1145/internet-usage-worldwide/chart/1241/global-browser-market-share/
Less than five years after its first release in September 2008, Google Chrome has firmly established itself as the no. 1 web browser in the world.
According to web tracking firm StatCounter, Chrome’s global market share in June 2013 was 43 percent, up from just 33 percent a year ago. At 25 percent market share, Internet Explorer remains the second most popular browser in the world. Microsoft’s browser retains a particularly strong position in North America, where it is almost head to head with Chrome. Despite its allegedly inferior performance, many workers in the U.S. are still obliged to use Internet Explorer at work, but tend to switch to the competition in private life. This theory is supported by StatCounter’s data, which shows that Microsoft’s usage share dips on weekends while other browsers, particularly Apple’s Safari, spike upwards on Saturdays and Sundays.

source: icharts.net
While most people hold strong favoritism to their favorite brands, some are open to change their product if it for the right reason. In the car category price was overall the highest rated purchasing factor.
Price is the largest factor in the U.S. and is prominent in other regions.

http://www.statista.com/topics/985/samsung-electronics/chart/1248/samsung-s-profit-growth/
Samsung Electronics missed analyst expectations when the company pre-announced its second quarter earnings. The Korean company, a market leader in semiconductors and consumer electronics, posted an operating profit of 9.5 trillion Won ($6.5 billion) on sales of approximately 57 trillion Won ($39 billion).
Even though this qualifies as another record quarter for Samsung, investors and analysts were disappointed by the results as they signify a noticeable slowdown of the company’s profit growth. Analysts had expected operating profits in excess of 10 trillion Won and blame lackluster demand for high-end smartphones for the target miss. It appears as if Samsung is starting to face the same problem that Apple has suffered from for a while now: having raised the bar so high for themselves, both companies find it increasingly hard to match expectations.
Since the beginning of the year, Apple shares have fallen by about 21 percent, while Samsung is down 16 percent.
Now you too can join in on the fun!
This site is can be used on tablets and smartphones while you sit in on those so important Strategy meetings. If you get a big promotion as a result of using this dynamic tool, remember who shared it with you!
http://www.changedesigns.net/public/other/strategy-jargon.html

Online news access by smartphone or tablet is becoming more and more popular in the states. Meanwhile one in four Americans use a smartphone to access online news, 16% consume news by tablet. The report examines various aspects of news consumption across different markets and contains a mixed bag of results for the struggling newspaper industry. The research was conducted at the end of January/beginning of February 2013.

There are some differences in user behavior between iPhone and Android platforms. Click on this link User Behavior Differences: iPhone vs Android to view the chart from iCharts. Research continues to bear out iPhone users are most profitable (possibly due to the price entry point of acquiring the iPhone), and they are most likely to be engaged in economic activity between the two platforms. But Android users are still talking on their phones while iPhone users are texting more (possibly due to their contracts with service providers). And overall, iPhone users are finding ways to use their devices more through the day. As Siri is developed more and can become a personal assistant, this will drive up iPhone users daily usage.

Six decades ago, Edmund Hillary and Tenzing Norgay reached the summit of Mount Everest, becoming the very first climbers to conquer the world’s tallest mountain. Since that incredible feat in May of 1953, the summit of Everest has become increasingly congested.
More and more climbers are now reaching the summit, thanks to advances in mountaineering equipment. Indeed, scaling Everest is becoming a lucrative business, with westerners forking over anywhere between $10,000 and $100,000 for permits to climb it.
The increasing number of climbers tackling Everest has resulted in immense gridlock and irritating waiting periods near the summit – 234 climbers reached the peak on one day in 2012. More than 500 people reached the top of Everest annually over the course of the last three years, using modern weather forecasts to time their attempts. Back in 1980, a mere ten climbers stood on top of the world.
Attempts to reach a solution and protect amateur mountaineers have divided the climbing community. Proposals to install ladders on treacherous rock faces have angered professionals who do not want to see the challenge of Everest undermined. Until 1985, authorities in Nepal only permitted one expedition on a route to the summit at any one time. Reviving this rule may prove a realistic long-term solution to alleviate the Everest ‘traffic jam’.

Today’s chart shows changes in newspaper circulation and advertising revenue between 2008 and 2012.
http://www.statista.com/topics/994/newspapers/chart/1158/no-signs-of-a-newspaper-crisis-in-asia/
Over the past few years, there have been countless news stories about the decline of the newspaper industry.
Our media habits have indeed changed significantly over the past few years, and whoever used public transit in the recent past, gets an idea of what the newspaper industry is competing with.
Considering this, the fact that newspaper advertising revenues have declined 22 percent between 2008 and 2012 hardly comes as a surprise.
What’s surprising though, is the fact that newspapers in some parts of the world have been spared by the curse of the internet. Newspapers in Asia and Latin America have actually seen substantial increases in circulation and ad revenue over the past five years.

Today’s chart shows estimated consumer book sales in the United States from 2008 through 2017.
The U.S. eBook market will surpass the printed book market in 2017. This according to a projection by PwC (PricewaterhouseCoopers), who published its annual “Entertainment & Media Outlook” this past week.
PwC estimates that trade eBooks (excluding educational publications) will reach $8.2 billion in sales by 2017 to surpass printed book sales, which are expected to fall from $11.9 billion in 2012 to $7.9 billion in 2017. Overall book sales are expected to stay below their 2008 level, as eBook sales fail to fully offset the decline in printed book sales. Also known as cannibalization.
Does this mean we are reading less? Probably not! Even if book sales remained unchanged in terms of units, the shift to eBooks would lead to a decline in dollar sales, as the average selling price for eBooks is lower than it is for printed books.
Another interesting question arises, “With the technology to make eBooks possible, is the long-tail of the market being served?”

Today’s chart shows the world’s ten most valuable brands in 2013.
http://www.statista.com/markets/14/media-advertising/chart/1122/most-valuable-brands-in-2013/
Despite the difficulties Apple has faced as a company in the past six months, the Apple brand remains as strong as ever. That’s according to Millward Brown’s Brandz Top 100 ranking published last week. Millward Brown estimates the implicit value of Apple as a brand at $185 billion, up from $183 billion in 2012. Apple’s strong image allows the company to continue charging a significant premium for its products, even in cases where its competition has caught up technologically. The average selling price of Apple’s iPhone is currently around $600, a price that Apple’s competitors can rarely push through.
With Google and IBM, two more technology brands complete the Top 3. Although both companies are trailing Apple’s brand value by a significant margin, at $114 billion and $113 billion respectively, they still hold a commanding lead over the high-profile consumer brands McDonald’s and Coca-Cola. With an estimated brand value of $70 billion, Microsoft dropped two ranks compared to last year’s ranking, as the brand’s image has suffered from the negative press associated with the lacklustre start of Windows 8.
Among Porter’s 5 Competitive Forces, the Threat of Substitution can be the more difficult threat to identify. There have been blogs criticizing Porter’s 5 Forces as anachronisms of the manufacturing past. Further those critics posit the 5 Forces are irrelevant today in the new economy. Here is a recent example of why Porter’s 5 Forces should remain on each executive’s desks.
A little more than three years have passed since the first iPad went on sale in April 2010.
Back then, not even the keenest optimists could have predicted the impact of what was then mocked as an oversized iPod Touch.
Tablets have changed the way we interact with media, the way we shop and, in many cases, replaced the PC as our primary computing device.
As tablets and smartphones have become powerful enough to handle virtually any computing task thrown at them, the workplace is probably the last stronghold of the traditional PC.
PC shipments have recently declined significantly and according to IDC’s latest forecast the industry will stagnate for years to come. In 2015, tablets are expected to outship PCs for the first time as the chart nicely illustrates.
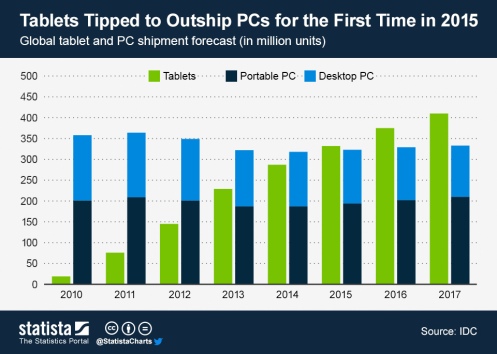
http://www.statista.com/topics/841/tablets/chart/1138/tablet-and-pc-shipment-forecast/
Within the tablet market, there is an ongoing shift towards lower cost, smaller tablets, such as Apple’s iPad mini or Google’s $200 tablet Nexus 7.
In 2013, 8-inch and smaller tablets are expected to account for the majority of global shipments for the first time, as consumers apparently prefer portability and price over larger screens and processing power.
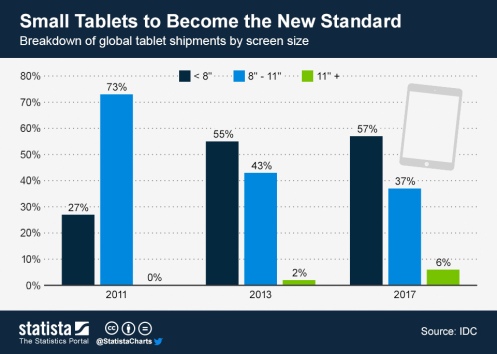
http://www.statista.com/topics/841/tablets/chart/1136/breakdown-of-tablet-shipments-by-screen-size/

Today’s chart shows Amazon’s revenue and profit growth since 1997.
http://www.statista.com/topics/846/amazon/chart/1126/amazons-aggressive-growth-strategy/
Amazon has been one of Wall Street’s darlings in the past decade. Amazon’s stock price jumped 234 percent in the past five years alone, giving the company a valuation of around $120 billion.
In those five years, Amazon’s sales have tripled to more than $60 billion a year, while its profits stayed remarkably flat. The reason for Amazon’s stagnant profit is its founder’s notorious commitment to long term growth. Jeff Bezos, who founded Amazon in 1994 and has lead the company ever since, has a track record of investing everything his company earns right back into it.
Defending his investment strategy in his latest letter to shareholders, Bezos wrote: “Proactively delighting customers earns trust, which earns more business from those customers, even in new business arenas.”
This way, Amazon became the largest online retailer in the world and in the same way the company is now striving to become a dominant force in the distribution of digital media.
So far, investors seem to believe in Amazon’s long term success, but some day the company is going to have to proof it can turn a sizeable profit.
It is as Bezos recently noted: “In the short run, the market is a voting machine but in the long run, it is a weighing machine. We’re always working to build a heavier company.”

This last week Yahoo! and Tumblr announce the agreement to terms of Yahoo!’s purchase of Tumblr. The purpose of the acquisition is simple enough. Eyeballs. Yahoo! needs more eyeballs to justify an advertising strategy.
Another popular blogging site is WordPress.
Ten years ago, on May 27, 2003, the first version of WordPress was released by its founders Matt Mullenweg and Mike Little.
The open source blogging tool currently powers 66 million websites, including high profile users such as TechCrunch and CNN. WordPress websites generate more than 4 billion pageviews from 368 million people per month.
http://www.statista.com/markets/21/internet/chart/1129/wordpress-turns-10/

Yesterday, Microsoft introduced the next generation of its Xbox video game console. The Xbox One will compete with Nintendo’s Wii U and Sony’s PlayStation 3 in a market that has been radically transformed in the past few years. Now that smartphones and tablets deliver high quality gaming content to everyone that has a few dollars to spare, home consoles need to provide customers with additional features in order to lure them into paying hundreds of dollars for a dedicated gaming device.
Microsoft’s strategy with the Xbox One is pretty clear. With its abilities to stream video content and pass through signals from a cable set-top box, the new console is designed to become the center of the living room. With voice and gesture controls, Xbox Home could add some of the features to the TV experience that have been part of the consistent Apple TV rumours.
Today’s chart shows that the use of video game consoles has already extended beyond gaming. According to Nielsen data, one third of the time Americans spent with the Xbox 360 was dedicated to activities other than gaming in the past year. This trend will likely be accelerated by the arrival of the new consoles, which will ring in a new round in the battle for the living room crown.

Today’s chart shows the global penetration of the world’s ten largest social media sites.
http://www.statista.com/topics/1164/social-networks/chart/1103/top-10-social-networks-in-q1-2013/
Facebook remains the world’s largest social network by a wide margin. The big question is will they be able to leverage a mobile platform with this large base and dominate the advertising revenues from this? Or will one of the other competitors leap frog them with innovation? This is still the most vibrant example of the Sheth Rule of Three today.
According to GlobalWebIndex, 51 percent of the world’s internet users were active on Facebook in the first quarter of 2013.
Google+, once referred to as a ghost town, has steadily built a remarkable user base and now ranks second with a penetration rate of 26 percent.
The Top 10 are completed by YouTube, Twitter and six Chinese social networking sites.
Back in February 2012, when Facebook announced its plans to go public, the tech world immediately went crazy. The hype was enormous over what should become one of the biggest IPOs of all time. On May 18, Facebook started trading at $38, giving the company an implied valuation of $104 billion. Unfortunately, what was supposed to be a sure shot investment, turned out to be a dud.
On its first trading day, the stock closed just above its IPO price but only thanks to the company’s underwriters, led by Morgan Stanley, who bought heavily to keep the stock above its offering price. The next week, Facebook’s stock began crashing and it did so until it hit rock bottom at a price of $17.73 on September 4. Those who had bought shares at the offering price of $38 had lost 54 percent of their initial investment in less than four months.
After Facebook’s biggest lockup expiration in November did not entail the feared fire sale, Facebook’s stock slowly started to recover. Carried by decent results and the introduction of mobile advertising products, the stock gradually climbed back up, but as of yesterday it is still closer to its all-time low than it is to its IPO price.

Those who bought Facebook shares at $38 are still down 30 percent and there are countless investments that would have yielded better results over the past year.
Remarkably, even AOL and Yahoo, both internet companies of the first generation that had already been pronounced dead, would have been much better investment choices than the much hyped Facebook IPO. Had one invested $1,000 in Yahoo shares a year ago, one would hold $1,787 today, instead of the lousy $688 that Facebook’s early investors have left.
Here’s how some other $1,000 investments would have played out over the past year:
| Present value of $1,000 investment on May 17, 2012 | |
|
$687.63 |
|
| Apple |
$837.39 |
|
$1,450.72 |
|
| Yahoo! |
$1,787.49 |
| AOL |
$1,646.83 |

The ever-growing adoption of smartphones and tablets has led to a surge in mobile web usage over the past few years. Thus far in 2013, mobile devices accounted for 14 percent of global page views, up from just 3 percent in 2010.
Surprisingly, at first glance, mobile web usage is especially popular in Africa and Asia, where mobile devices account for 17 and 23 percent of total page views, respectively. The likely explanation being, that fixed line internet access is far from a given in these regions.
As people spend more and more time with smartphones and tablets, we expect the share of mobile web traffic to further increase through the next few years, even though people spend a lot of their smartphone online time with dedicated apps.
For marketers, it is impossible to ignore the fact that mobile is the future. Services such as Facebook are currently experiencing a strong shift towards mobile use, and advertising dollars are likely going to follow.

Today’s chart shows the global market share of selected desktop operating systems in April 2013.
http://www.statista.com/topics/823/microsoft/chart/1084/the-windows-8-disaster/
After weeks of rumours, Microsoft confirmed that it will release a major update to Windows 8 later this year. The update, codenamed “Blue”, will probably address the usability problems many users of the radically redesigned operating system have complained about. Tami Reller, a high-level executive working in Microsoft’s Windows division, admitted that Windows 8 has a learning curve and that usability could be improved.
The release of a potentially significant redesign within a year of the initial release indicates that Microsoft is truly worried about the performance of Windows 8. A look at the latest market share figures won’t do much to calm those worries. Half a year after its release in October 2012, Windows 8 adoption remains weak, as the majority of PC users favours Windows 7 and Windows XP over the latest Windows version. Even the vastly unpopular Windows Vista remains ahead of Windows 8 in terms of market share. This is according to market researcher Net Applications, who tracks billions of pageviews per month on 40,000 websites worldwide.
The pressure is definitely on for Microsoft, as “Blue” could be the last chance to fix Windows 8 and turn it into the success the company needs it to be. Their other option is to add a scratch and sniff option with the scent of bacon. Everyone loves bacon!

Today’s infographic illustrates how the U.S. music industry has changed in the past 15 years, as digital downloads gradually displaced physical music distribution. http://www.statista.com/topics/1386/digital-music/chart/1075/the-digital-music-revolution/
10 years ago, on April 28, 2003, Apple’s iTunes Store opened its gates and rang in a new era for the music industry.
In the early 2000s, CD sales had started to decline and the music industry was struggling to adapt to the new realities. The The Threat of Substitution (One of Porter’s Five Competitive Forces). Instead of working on a digital distribution model that was affordable and convenient to use, the industry tinkered around with digital watermarks and other copyright protection mechanisms that put off many potential customers. The Industry responded in by using a non-competitive force, the legal system. In the meantime, illegal file-sharing services such as Napster, Kazaa and others flourished as they offered consumers easy access to virtually unlimited amounts of music.
In 2002, Apple’s CEO Steve Jobs once again proved his impeccable sense for what consumers wanted and identified an opportunity to promote his company’s young iPod business. He believed music fans wanted easy and affordable access to music files and he decided that Apple should provide them with that access. Jobs started talking to major record labels and won them over with presentations that showcased early versions of the iTunes interface and its seamless integration with Apple’s digital music player, the iPod. Against his beliefs, he agreed to include some digital rights management, but in turn pushed hard for what became the iTunes killer feature: the option to download individual songs for 99 cents.
Within its first week, iTunes sold one million downloads and quickly became the largest music retailer in the United States.
For the music industry, iTunes was both a blessing and a curse. On the one hand the industry had finally found a digital distribution model that was accepted by consumers, but on the other hand iTunes was another nail in the coffin of the industry’s biggest cash cow, the CD.
Ten years later, digital music accounts for roughly 60 percent of music revenues in the United States as the next revolution is knocking on the door. Music subscription services such as Pandora or Spotify are increasingly popular and even Apple is rumoured to be working on a subscription model next to its “traditional” per-per-download model.

http://www.statista.com/topics/840/smartphones/chart/1071/top-5-smartphone-vendors-in-q1-2013/
The global smartphone market grew 42 percent in the first quarter of 2013 as smartphones outshipped feature phones for the first time. In the three months that ended March 31, 216.2 million smartphones were shipped as opposed to just 202.4 million feature phones, reports IDC.
As the overall market grew, Samsung was able to strengthen its position as the undisputed market leader. The Korean electronics giant shipped more than 70 million smartphones in the first quarter, a 60 percent increase over last year’s March quarter. What’s truly astonishing is the fact that Samsung shipped more smartphones in the first quarter than the next four vendors did combined! That includes former market leader Apple, who shipped 37.4 million iPhones and showed the weakest relative growth among the Top 5 vendors.
LG Electronics managed to return to the Top 5, mainly thanks to strong sales of the Google-branded Nexus 4, which is manufactured by the Korean company. Chinese vendors Huawei and ZTE complete the Top 5 with 9.9 and 9.1 million shipped units, respectively.
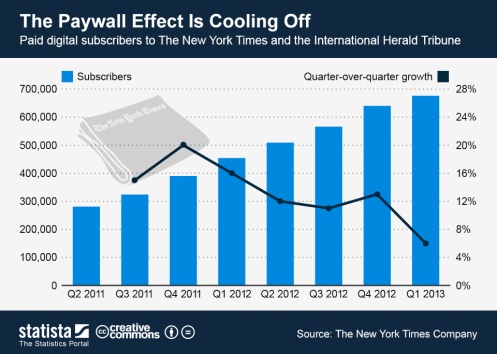
Today’s chart shows the New York Times’ digital subscriber growth.
http://www.statista.com/topics/994/newspapers/chart/1067/the-paywall-effect-is-cooling-off/
The New York Times paywall has been a remarkable success since its introduction in March 2011. The digital subscription model enabled the Times Company to stabilize faltering circulation revenue, as digital subscriptions offset the losses of the Times’ print business. By the end of March 2013, the New York Times and the International Herald Tribune had 676,000 paying digital subscribers, a remarkable achievement.
It’s not all good for the world’s most renowned newspaper though. In the first quarter of 2013, digital subscriber growth slowed down significantly, dropping to just 6 percent quarter-over-quarter. Moreover, for the first time in two years, the rise of digital revenues was too small to make up for the loss of advertising and print revenues. Total circulation revenue of the New York Times Media Group grew 8 percent in the March quarter, but as advertising revenue dropped 11 percent, the Group’s total revenue declined 1 percent.
The New York Times Company obviously acknowledges the problem, as it released a note alongside its earnings report introducing a “new strategy for growth”. In the hope to re-accelerate digital subscriber growth, the company announced the introduction of lower-priced digital subscription models to expand its potential audience. Furthermore the company announced that videos will henceforth be excempt from the paywall in an attempt to build a larger video audience and improve advertising sales.
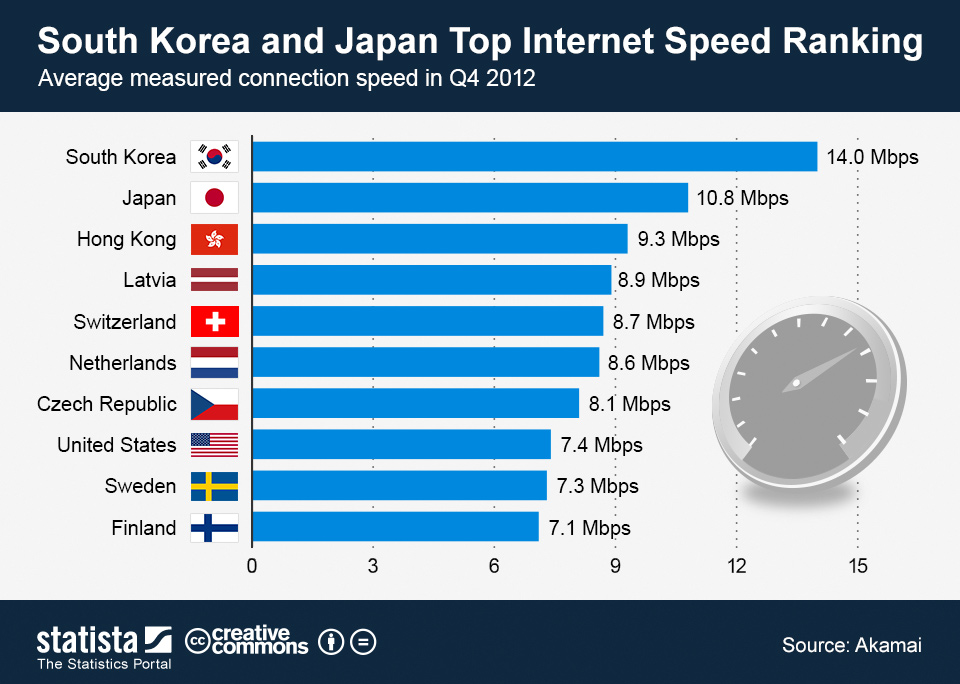
Today’s chart shows the 10 countries with the highest average internet connection speeds as measured by Akamai.http://www.statista.com/topics/1145/internet-usage-worldwide/chart/1065/south-korea-and-japan-top-internet-speed-ranking/
Akamai published its quarterly “State of the Internet“ report this week. The report examines the current state of IP security, connection speeds and internet penetration at a global scale.
For some time now, South Korea has boasted the highest average internet connection speed in the world. In the fourth quarter of 2012, South Korean internet users surfed at an average speed of 14 Mbps, nearly twice as fast as Americans whose connection speed averaged at 7.4 Mbps. To add a little perspective: at 7.4 Mbps, it takes roughly an hour to download a 2-hour movie in HD quality (file size 3GB-4GB).
The United States places 8th in the global speed ranking that is topped by South Korea, Japan and Hong Kong, who are followed by the European nations of Latvia, Switzerland, the Netherlands and the Czech Republic. Will the competitive edge technologically shift continue to shift to the emerging countries? Will the cost of replacing legacy investments in older infrastructure prevent the first world countries from maintaining their current edge?
The global average connection speed in Q4 2012 was 2.9 Mbps, up 25 percent from the fourth quarter of 2011.
In many countries, internet connections are now fast enough to enable users to stream HD video content, which has led to the rise of streaming services such as Netflix and to a vast increase of global IP traffic. A recent Cisco study predicts global traffic to more than double between 2012 and 2015, with video content accounting for more than 50 percent of the worldwide total.

http://www.statista.com/topics/847/apple/chart/1063/apple-reports-first-profit-decline-in-a-decade/
Today’s infographic sums up Apple’s latest results as reported on April 23, 2013.
Yesterday after market close, Apple reported its first quarterly profit decline since 2003. The company reported net earnings of $9.55 billion for the quarter that ended March 31, an 18 percent decline over last year’s March quarter. Apple’s exceptionally high profit in Q2 2012 had been powered by the release of the iPhone 4S in China. Hence the decline was somewhat to be expected.
Apart from the profit decline, Apple’s results were slightly better than expected. The company sold 37.4 million iPhones, 19.5 million iPads and posted the highest non-holiday quarter revenue ever. And even though it seems as if the years of massive double-digit growth are behind Apple for now, the company still has an incredibly strong business.

http://www.statista.com/topics/842/netflix/chart/1062/netflix-successful-transition/
In July 2011, Netflix CEO Reed Hastings announced a new pricing model separating its streaming service from DVD-rentals. The combined subscription that had previously cost $9.99 was split into two separate plans at $7.99 each. The pricing reform was followed by public outcry over what was effectively a 60 percent price hike for subscribers of both services.
Hastings insisted that the change was necessary to ensure his company’s future success, but Netflix’s stock began tumbling nonetheless. To make things worse, Netflix announced in September that it would spin-off its DVD business into a newly-formed company called Qwikster, only to discard the plan a few weeks later. This episode did not fare well with customers and investors alike and by the end of the year Netflix’s share price was down more than 70 percent. The stock hit rock bottom in August 2012. By then, Netflix had lost more than 80 percent of its value since July 2011.
Since August, Netflix slowly regained the trust of customers and investors. The company invested in original content such as the critically acclaimed “House of Cards” and the highly anticipated return of cult comedy “Arrested Development”, and results started to improve. After Netflix had announced positive fourth quarter results in January, the company’s stock jumped more than 40 percent in a day and gained around 80 percent in a matter of weeks.
The same thing happened yesterday. The stock jumped more than 20 percent in after hours trading after Hastings had announced that his company had added more than 2 million domestic streaming subscribers since January. Adding to Netflix’ investors’ new found confidence was the fact that the company’s operating profit started to re-accelerate, indicating that the company has a future as a profitable streaming company.
It looks as if Hasting’s unpopular decision in July 2011 may have enabled his company to master one of the biggest challenges a business can face: responding to a new technology that threatens to obliterate the market you’re winning in. By using the money from the highly profitable DVD business to heavily invest in the growth of Netflix’ streaming business, Reed Hastings may have saved his company.

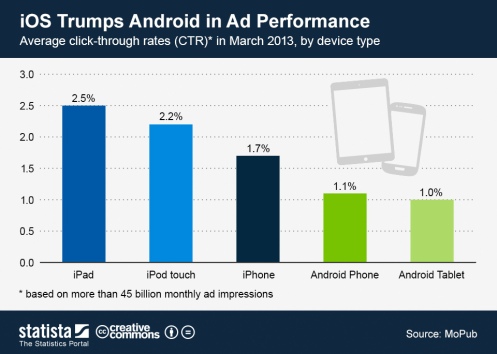
According to two studies published last week, Apple’s iOS still has the edge over Android in terms of mobile advertising.
Opera Mediaworks, a mobile ad platform serving more than 50 billion impressions per months, reports that iOS devices accounted for 45 percent of mobile ad impressions as opposed to Android’s 21 percent. In terms of mobile ad revenue, the difference between the two platforms is even bigger: iPhone, iPad and iPod touch accounted for 49 percent of ad revenue, while Android phones and tablets accounted for no more than 27 percent of the first quarter total. The discrepancy between share of impressions and revenue share hints that ad impressions on iOS devices are on average more expensive then they are on Android devices.
The second study,http://www.statista.com/topics/983/mobile-app-monetization/chart/1058/ctr-of-mobile-ads-by-device-type/ published by mobile ad server MoPub, serves one possible explanation as to why iOS ads are more expensive then those served to Android devices: they are much more effective. In March 2013, the average click-though rate on iOS devices ranged from 2.5 percent on the iPad to 1.7 percent on the iPhone. The average CTR on Android devices was significantly lower at 1.1 percent (Android phones) and 1.0 percent (tablets).

Yahoo reported its earnings for the first quarter of 2013.
Today’s chart illustrates Yahoo’s results from the first quarter of 2008 through the first quarter of 2013.
http://www.statista.com/markets/21/topic/195/search-seo/chart/1051/yahoo-s-business-in-numbers/
Yahoo’s net profit increased 36 percent to $390 million, mainly thanks to the company’s remaining stake in Alibaba and the rigorous cost-cutting measures implemented by CEO Marissa Mayer.
Revenue declined 7 percent to $1.14 billion in the first quarter, as Yahoo’s core business, selling ads, performed disappointingly. Display ad revenue fell 11 percent, as the number of ads sold dropped 7 percent.

Today’s chart illustrates the rise and fall of newspaper revenues in the United States since 1956. All numbers are expressed in constant 2013 U.S. dollars.
http://www.statista.com/topics/994/newspapers/chart/1043/newspaper-revenues-in-the-united-states/
The U.S. newspaper industry pulled in $33 billion in circulation and ad revenues last year. What sounds like a lot of money is still a low point in the long history of newspapers in the United States. Adjusted for inflation, 2012 newspaper revenues were 15 percent lower than they were in 1956.
Since hitting a peak in 2000, when newspapers raked in almost $80 billion, the industry has all but collapsed. The internet boom caused print advertising revenue to decline more than 70 percent since 2000, while circulation revenue dropped by a quarter. Advertising on newspaper websites now accounts for more than 10 percent of the industry’s revenue. However, given the fact that print ad revenue dropped by more than $45 billion since 2000, the $3.4 billion in online ad sales seem like a mere drop in the bucket.

Today’s chart shows worldwide PC shipments by the Top 5 vendors in the first quarter of 2013. http://www.statista.com/topics/1070/pcs/chart/1037/global-pc-market-in-q1-2013/
Worldwide PC shipments suffered the steepest decline ever in the first quarter of 2013. According to IDC, the industry shipped a total of 76.3 million units between January and March, a 13.9 percent decline over last year’s first quarter.
The industry is faced with the classic Threat of Substitution (Porters Five Competitive Forces) from the rise of smartphones and tablets, which are gradually replacing PCs as the primary computing device for many consumers.
The release of Windows 8 failed to deliver the impetus to the industry many insiders had hoped for. The radically changed user interface, Microsoft forced on consumers with Windows 8, apparently scares potential buyers away instead of winning them over.
By the end of March, six months after its launch in October 2012, Windows 8 had reached no more than 3.9 percent market share. Its predecessor Windows 7 had already reached double-digit adoption six months after its launch in October 2009.
